
8 min read ·
America’s Reported Padel Footprint: 296 Facilities Across 38 States
Compare the reported U.S. padel totals for Q2 2025 and Q2 2026, see facilities versus courts, and understand what the 296-venue count does and does not cover.
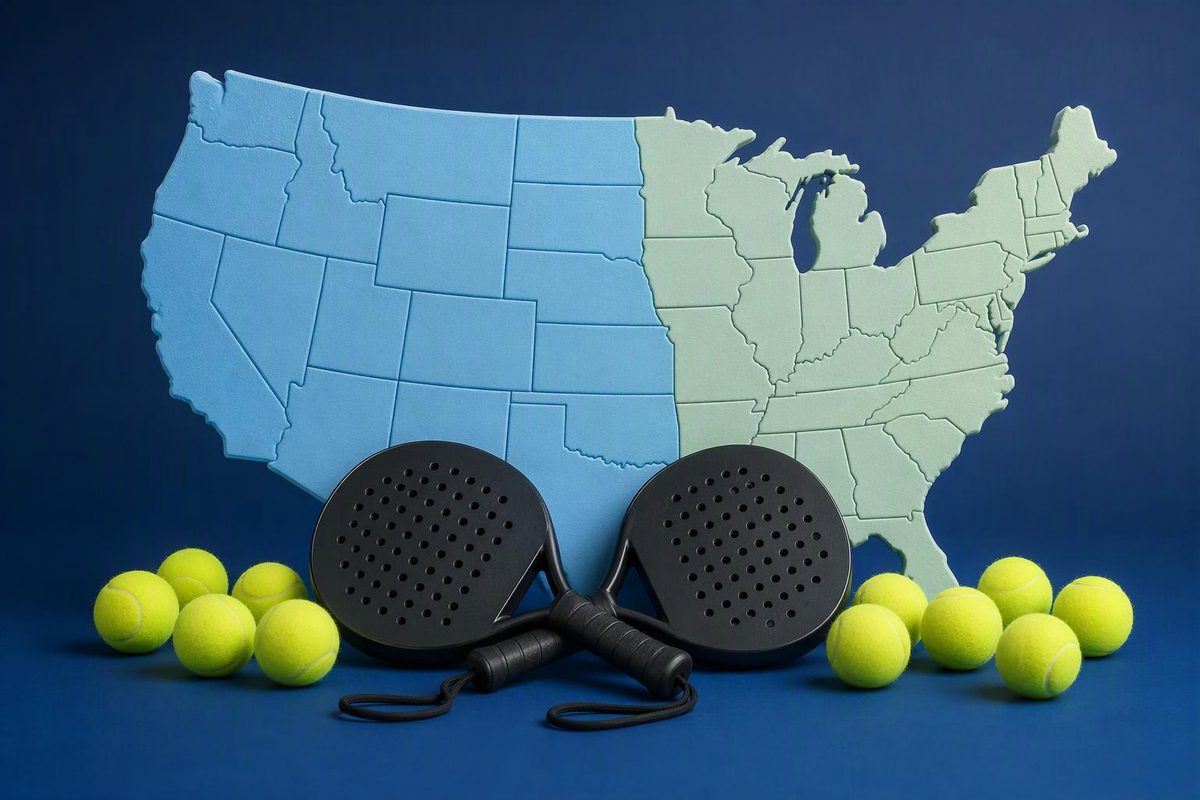
The reported U.S. total is 296 active padel facilities, containing 1,110 operating courts across 38 states, as of Q2 2026. Those figures come from Misitrano Consulting’s US Padel Report 2026, as reported by Sports News Blitz and Citybiz.
Here, “America” means the United States, not North, Central and South America combined. The observation date matters: 296 is a Q2 2026 snapshot, not a live October 2026 total. It is also a reported industry count, rather than an independently audited census available in the public summaries.
Choose facilities, courts or states to compare the reported Q2 snapshots.
U.S. Padel Snapshot Comparison
| Measure | 2025 | 2026 | Added* |
|---|---|---|---|
| Facilities | 180 | 296 | 116 |
| Courts | 688 | 1,110 | 422 |
| States | 31 | 38 | 7 |
Count and Calculation Caveats
*Added means net change between reported totals, not a verified tally of openings. Facility and court growth percentages are calculated from the counts. The summaries quote 65% and 61.6%, respectively.
Facilities are venues; courts are playing spaces. The 2026 count includes 117 facilities that also offer pickleball. State presence does not establish public access or an even geographic distribution.
These are U.S. snapshots, not a live count or a total for the Americas. The public summaries do not provide an independently audited facility list.
Sources: 2025 report launch release; Misitrano Consulting’s US Padel Report 2026, as covered by Sports News Blitz and Citybiz. Changes calculated from published counts.
The Answer Is 296 Facilities, Not 1,110 Courts
For a question about how many padel facilities exist in the United States, 296 is the relevant figure. A facility is the venue-level measure; courts are the individual playing spaces within those venues. Substituting the court count would answer a different question and substantially overstate the number of locations.
The distinction also changes how growth should be read. An existing venue can add courts without adding another facility. A new venue can increase both measures. The national totals show the net change in each category, but they do not identify how much court growth came from existing locations versus new ones.
The reported totals imply ~3.8 courts per facility nationally: divide 1,110 operating courts by 296 active facilities. That is an arithmetic average, not a description of the typical club or evidence that most venues have four courts. Without a facility-level distribution, the average cannot tell us how many locations have a single court, how many are large clubs, or which venue size is most common.
Nor does “padel facility” necessarily mean a padel-only business. Citybiz’s report coverage says 117 facilities also offer pickleball, representing 39.4% of the 296-facility total. Mixed-sport venues are therefore included. The national figure should not be described as a count of businesses devoted exclusively to padel.
That distinction is useful when comparing venue directories or commercial market estimates. A list limited to padel-only clubs would be measuring a narrower category than this reported facility total, even if both lists used the word “club.”
Facilities Grew 64.4% From the Published Counts
The reported counts give the following comparison. Percentage changes in the table are calculated from the published totals, rather than copied from headline growth claims.
| Measure | Q2 2025 | Q2 2026 | Calculated Change |
|---|---|---|---|
| Active facilities | 180 | 296 | +116; 64.4% |
| Operating courts | 688 | 1,110 | +422; 61.3% |
| States with padel operations | 31 | 38 | +7 states |
The baseline comes from the 2025 report’s launch release. The 2026 figures appear in Sports News Blitz and Citybiz. Both publications attribute them to Misitrano Consulting; they are two accounts of the same report, not independent censuses.
For facilities, the comparison is 296 minus 180, giving a net increase of 116. Dividing that increase by the 180-facility baseline gives 64.4% growth. For courts, 1,110 minus 688 gives a net increase of 422, or 61.3% relative to the baseline.
These are changes between reported snapshots. The facility difference is not necessarily a count of all openings during the interval. A net increase can reflect openings, closures and changes in what the research identifies or includes. The public summaries do not provide a reconciliation that separates those components.
The same caution applies to courts. An increase of 422 in the operating-court total does not establish that every one of those courts belonged to a newly opened facility. The table measures the change in the reported operating footprint, not a construction pipeline or an opening-by-opening inventory.
The Published Totals Do Not Show a Doubling
The 2026 summaries quote growth of 65% for facilities and 61.6% for courts. Those reported rates differ from the percentages calculated directly from the displayed totals: 64.4% and 61.3%, respectively.
The public material supplied here does not explain the discrepancy. It would be speculative to attribute it to rounding, revised baselines or a different reporting cutoff. For a reproducible comparison, use the published counts and identify the resulting percentages as calculations.
If quoting the report’s growth language instead, preserve the attribution. “The report’s coverage quotes 65% facility growth” is different from saying that 180 to 296 mathematically equals 65%. Keeping those two statements separate avoids silently substituting one measure for another.
The broader verdict is unchanged: the reported U.S. footprint expanded substantially. But neither the facility total nor the court total doubled between the two snapshots. “Nearly doubled” is less precise than stating the actual totals and their calculated changes.
For a chart, presentation or market summary, the clearest pairing is therefore “180 to 296 active facilities; +64.4% calculated from the counts.” It communicates both the scale and the basis of the comparison without relying on a promotional description of growth.
Expansion Reached More States, Without Proving Equal Access
The reported number of states with padel operations increased from 31 to 38, a gain of seven states. That supports a conclusion that the footprint became geographically broader between the reported snapshots.
Growth also became less concentrated in the leading markets. According to Sports News Blitz’s coverage, Florida, Texas and California’s combined share of facilities fell from 65% to slightly above 50%, even as all three added venues.
A falling share does not mean those states lost facilities. Their combined share can decline while their own counts rise if the rest of the country grows faster. That is the distinction behind the report’s account of a broader geographic footprint.
However, “38 states” is a presence measure, not an accessibility measure. It does not establish how evenly facilities are distributed within those states, how close they are to population centers, or whether a player can use them without membership or other restrictions.
The public figures provided here also do not give a state-by-state facility table. They cannot support a ranking of every state or an exact count for a particular city. The national total and the leading states’ combined share should not be stretched into local estimates.
For someone looking for a place to play, the national count answers the scale question. It does not replace checking a specific venue’s location, access policy and current operation. A state appearing in the footprint is not evidence that padel is conveniently available throughout that state.
Mixed-Sport Venues Count, but Other Inclusion Rules Are Unclear
The pickleball overlap is one concrete inclusion detail available in the public coverage: 117 of the 296 facilities also offer pickleball. This shows that the facility category crosses sport-specific business boundaries.
It does not establish the complete business mix. The public summaries do not provide a breakdown of padel-only venues, other mixed-sport venues, public facilities, private clubs or residential settings. In particular, a venue not identified as offering pickleball should not automatically be classified as padel-only; it could offer other activities.
Sports News Blitz describes research involving scraping and interviews with clubs and operators. Its public coverage does not establish how private residential courts, restricted-access venues or temporary installations are treated. Those categories should remain unresolved rather than being assumed included or excluded.
The published category is active facilities, paired with operating courts. Those labels should not be expanded to include announced projects or courts under construction. A proposed venue and an operating venue represent different stages of market development.
Equally, “active” should not be rewritten as “open to anyone.” Operational status and public access are separate characteristics. Without explicit access rules, the reported count cannot be presented as the number of locations available for unrestricted public booking.
These limitations do not invalidate the count. They define what can safely be said about it: a reported total of active U.S. facilities, including some mixed-sport venues, with other facility-level inclusion rules not established by the accessible summaries.
The Public Evidence Supports Attribution, Not Independent Verification
Misitrano’s public report page offers the full report through a registration form but does not display the numerical tables or facility-level inclusion rules. The public summaries do not provide an independently audited facility list.
That leaves a distinction between a clearly attributed figure and a count that a reader can independently reproduce. The headline totals have an identifiable source. The material supplied here does not let a reader inspect every included venue, check its operating status, or reproduce the national aggregation.
Sports News Blitz and Citybiz help establish what the report says. Their agreement does not create a second measurement, because both are reporting Misitrano’s research. Counting the two publications as separate confirmations would overstate the independence of the evidence.
The described use of scraping and operator interviews gives some information about the research process. It does not, by itself, resolve coverage questions such as duplicate venue records, status changes or treatment of restricted-access locations. The public coverage does not show enough detail to assess those questions fully.
For editorial use, the appropriate response is attribution rather than false precision about certainty. “Misitrano Consulting reported” preserves the distinction between the industry report’s finding and an independently verified national census.
It is also better to keep “active facilities” and “operating courts” intact. Replacing them with broader terms such as “all padel sites” or “total courts built” changes the scope beyond what these figures establish.
Cite the Count With Its Geography and Observation Date
The defensible wording is: “Misitrano Consulting reported 296 active U.S. padel facilities and 1,110 operating courts across 38 states as of Q2 2026.” That sentence keeps the source, geography, categories and observation date attached to the numbers.
If only the facility answer is needed, shorten it to “296 active U.S. padel facilities, reported by Misitrano Consulting as of Q2 2026.” The court total is useful context, but it is not necessary to answer how many venues there are.
For a growth claim, include the baseline as well as the endpoint. The comparison is 180 active facilities in Q2 2025 versus 296 in Q2 2026, with 64.4% growth calculated from those counts. That is more transparent than presenting a percentage without showing what it compares.
Do not relabel the figure as a total for the Americas. The evidence discussed here concerns the United States only. It supplies no combined facility count for North, Central and South America.
Do not relabel it as a live current total either. The draft’s evidence does not provide a later October 2026 observation or a continuously maintained count. Venues may open, close or change status after a snapshot, but there is no supported adjustment to make here. 296 remains the reported Q2 2026 answer—not a claim that the total has stayed unchanged since then.