
3 min read ·
Padel vs Tennis vs Pickleball: What U.S. Participation Figures Show
Compare 2025 U.S. padel, tennis and pickleball participation, with survey sources, core-player definitions and limits on growth claims.
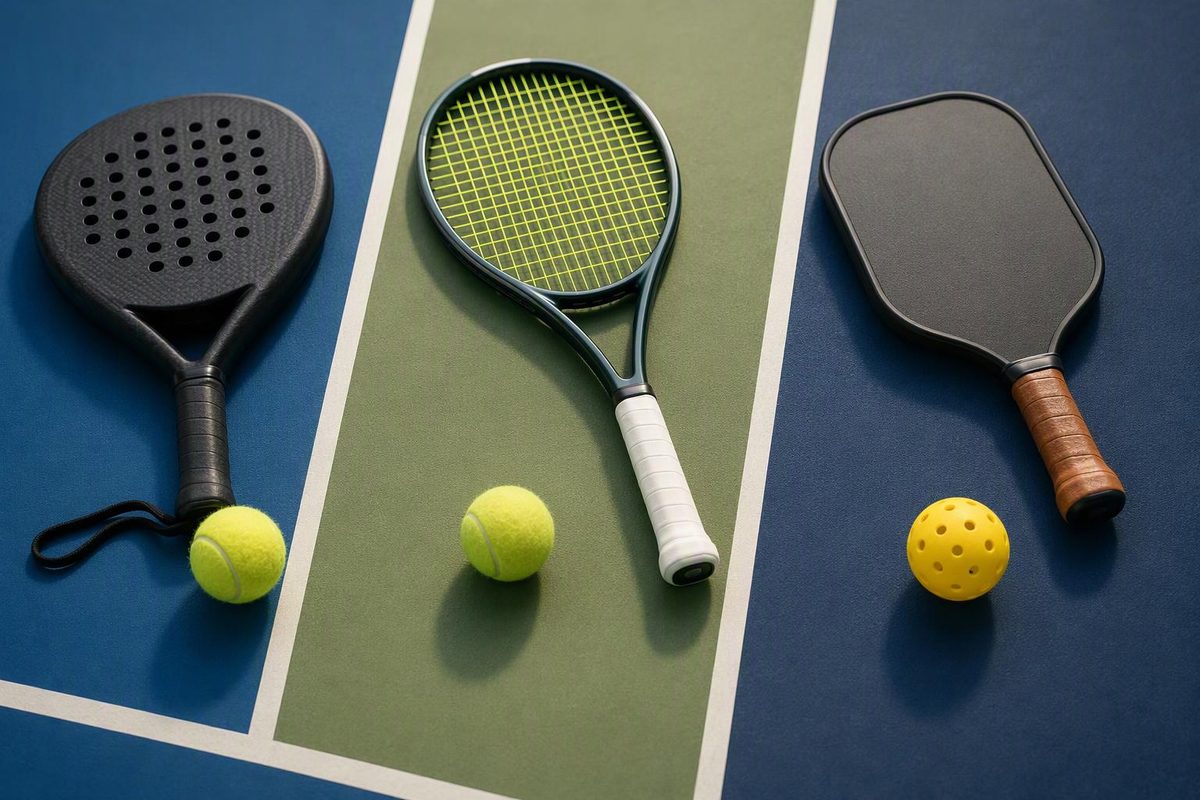
Padel has a much smaller U.S. participation base than tennis or pickleball. For 2025, SFIA estimates that ~1.07 million Americans played padel, compared with ~24.3 million playing pickleball. The USTA reports ~27.3 million tennis participants. These are annual participation estimates—not counts of weekly players, members or customers of domestic clubs. SFIA’s participation overview and the USTA’s 2026 report establish the scale.
A useful sports comparison separates three questions: How many people tried or played the sport? How often did they play? How quickly is that population changing? The answers need different measures.
Participation: the same country and year
The figures below cover U.S. participants aged six and older in 2025. A leading tilde marks an estimate; the displayed precision follows the source, not an exact headcount.
| Sport | Annual participants, 2025 | “Core” participants, 2025 | Core threshold | Source |
|---|---|---|---|---|
| Padel | ~1.07 million | ~238,000 | Eight or more times during the year | SFIA padel overview |
| Pickleball | ~24.3 million | ~7.5 million | Eight or more times during the year | SFIA’s June 2026 release |
| Tennis | ~27.3 million | ~14.5 million | Ten or more times during the year | USTA report, page 5 |
The USTA report’s racket-sports comparison defines annual participation as playing at least once. It also identifies 2025 as the first year of segmented padel reporting, rounding padel’s total to ~1.1 million. USTA report, page 12
Using the published rounded totals, pickleball had roughly 23 times padel’s annual participants, while tennis had roughly 26 times as many. That describes relative participation in the United States. It does not establish a worldwide ranking or the relative size of the professional games.
Nor should the three totals be added to produce a count of unique racket-sport players: someone who plays two sports can appear in both participation populations.
Comparable measures, but not identical surveys
SFIA says its participation research, conducted with the Physical Activity Council, uses 18,000 annual survey respondents aged six and older, with monthly data collection. These are survey-derived population estimates, not federation registrations or booking records. SFIA methodology summary
The USTA’s tennis estimate has a different construction. The National Golf Foundation analyzes two studies: the PAC study and the supplementary PLAY study, each surveying 18,000 people aged six and older annually. Its report describes statistical weighting and analysis across demographic groups. USTA report, page 3
The shared country, year, age coverage and annual-play measure make this a useful broad comparison. They do not make the underlying estimation procedures identical. The large gap between padel and the other two sports is more informative than ratios expressed to several decimal places.
Frequency changes the interpretation
Dividing each core estimate by its annual total gives core shares of approximately 22% for padel, 31% for pickleball and 53% for tennis. Those are calculations from the table, not additional survey findings.
Padel and pickleball use the same eight-times threshold, so their core shares offer a more closely aligned frequency comparison. Tennis uses ten times, meaning its core category is not exactly equivalent.
Importantly, neither threshold means weekly play. Eight or ten occasions could be concentrated in a short period or spread across the year. These figures cannot establish weekly participation, ongoing club retention or average spending.
For a padel operator, the annual total indicates reach; the core count adds evidence about repeat participation. Neither substitutes for local booking frequency and retained customers. Our guide to what a padel player count measures explains the distinction between annual participants, monthly players, registrations and ranked competitors.
Growth needs a comparable starting point
The USTA reports that tennis added ~1.6 million participants in 2025, an increase of about 6%. Its racket-sports chart puts pickleball at ~19.8 million in 2024 and ~24.3 million in 2025—roughly 23% growth using the displayed rounded figures. USTA report, pages 5 and 12
Padel’s first segmented reporting year gives a baseline, not a comparable year-on-year growth rate. These releases therefore do not support ranking padel’s U.S. participation growth against tennis and pickleball for 2025.
A court inventory would answer a separate question: how much infrastructure exists. More courts can increase opportunities to play, but court growth is not itself participant growth. Likewise, annual participants do not measure ticket sales, broadcast audiences or commercial revenue.
Before accepting a claim that padel is “bigger” or “growing faster,” ask for the geography, observation year, participant definition, method and comparable baseline. For this U.S. comparison, the evidence supports a clear size difference and a useful frequency breakdown—not a global fastest-growing-sport verdict.